
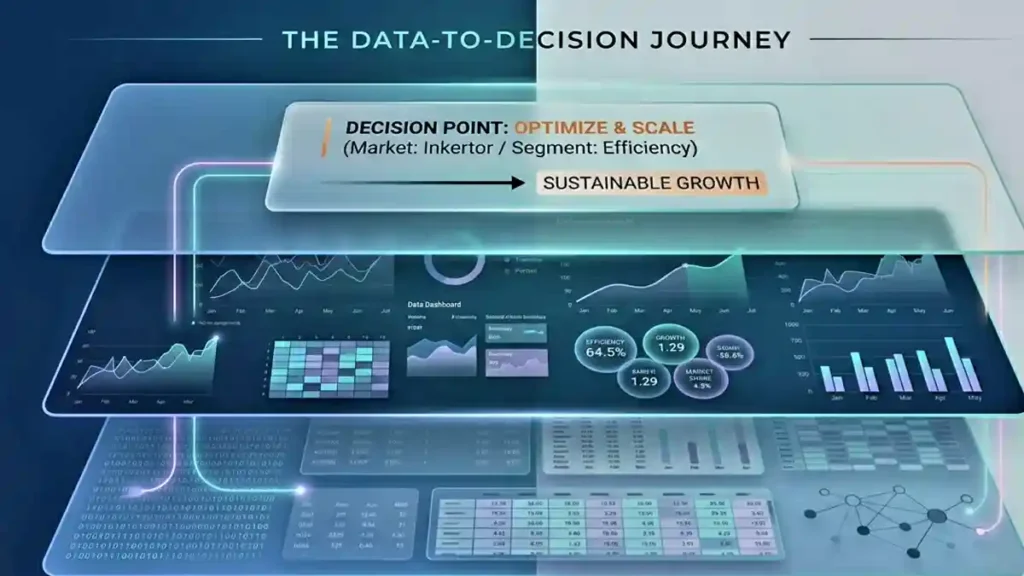
Everyone has dashboards. Everyone has reports. Very few people actually know what to do with them -and that gap is costing businesses real money.
Open your marketing dashboard right now. Go ahead.
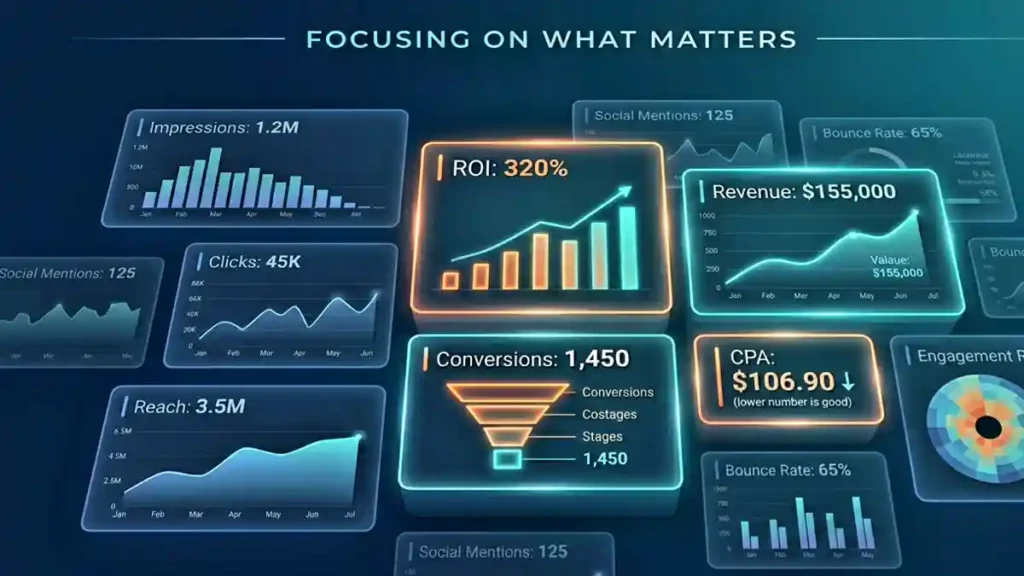
You’ll probably see impressions, reach, click-through rates, follower counts, session durations, bounce rates, engagement rates, and maybe a few more numbers you added because they sounded important at the time.
Now here’s the honest question: do those numbers actually help you make decisions?
For most businesses – and even for most marketers – the answer is quietly, uncomfortably: not really.
We’ve confused collecting data with understanding it. We’ve confused busy dashboards with clear thinking. We’ve built entire reporting systems around numbers that are easy to pull – not numbers that are useful to act on.
More data does not mean better decisions. And that’s the central problem with how “data-driven marketing” is practiced today.
“Tracking everything doesn’t mean understanding anything.”
The Real Problem Isn’t Lack of Data
When marketing campaigns don’t perform, the first reaction is usually: “We need more data.” Another tool. Another dashboard. Another attribution plugin.
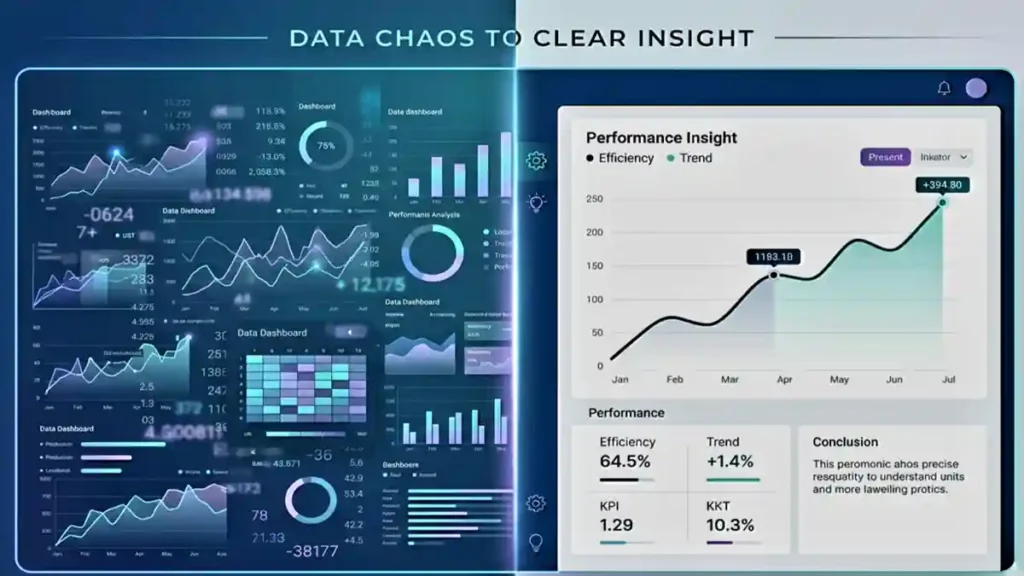
But the problem isn’t volume. It’s clarity.
Most businesses are drowning in metrics but starving for insight. They track what’s easy to track. Platforms like Meta, Google, and LinkedIn are incredibly generous with numbers — impressions, clicks, reach, CTR — because those numbers justify continued ad spend. But platform metrics are designed to show platforms in a good light. They’re not designed to tell you whether your business is actually growing.
The second problem is wrong KPIs. Teams optimize for what looks good on a report instead of what moves the business forward. You can hit every marketing target and still lose money. It happens more often than anyone admits.
And the third problem — which is the sneakiest — is measuring activity instead of outcomes. Posts published. Emails sent. Ads running. That’s activity. None of it is impact until it connects to something real: a lead, a sale, a retained customer, a referral.
“Focusing on what’s easy to measure is the oldest trap in marketing. Easy isn’t the same as important.”
What “Data-Driven” Should Actually Mean
Let’s reset the definition.
Data-driven marketing doesn’t mean you live inside spreadsheets. It doesn’t mean you A/B test the colour of every button or track 40 metrics per campaign. That’s not rigour — that’s anxiety dressed up as strategy.
Being genuinely data-driven means three things:
Decision support. You use data to make clearer decisions — not to justify decisions you’ve already made emotionally. There’s a big difference between these two things, and most teams do the second while believing they’re doing the first.
Direction over decoration. Numbers should tell you where to go next, not just where you’ve been. If your reporting only looks backwards and never shapes what happens on Monday morning, it’s decoration.
Prioritisation. You have limited budget, limited time, and limited attention. Good data tells you where to concentrate your effort for maximum return — not where to spread yourself thin trying to do everything at once.
That’s it. Data-driven marketing is really just: using the right information to make smarter choices, faster. The “data” part is secondary. The “smarter choices” part is what you’re actually after.
KPIs vs Metrics — And Why the Difference Matters
This is a distinction that sounds academic but is actually very practical once you feel it.
Think of metrics as activity and KPIs as impact.
A metric tells you something happened. A KPI tells you whether that something moved the needle.
Impressions are a metric. A qualified lead is a KPI. Because a qualified lead is connected to a real business outcome — it means someone who saw your message was interested enough to take meaningful action.
Website sessions are a metric. Conversion rate is a KPI. Emails opened is a metric. Revenue from email is a KPI.
The test is simple: if a number doesn’t influence a decision, it’s just a number. It might be useful context. But it shouldn’t live at the top of your dashboard, and it shouldn’t be the thing you optimise toward.
Good KPIs are connected directly to what the business is trying to achieve. They’re specific enough to track, but broad enough to mean something. And they should be the thing that, if it went up significantly, would make the business owner genuinely happy — not just the marketing manager.
Vanity Metrics vs Meaningful Metrics
This is the section that makes some marketers uncomfortable, because it calls out things we’ve spent years celebrating.
| Vanity Metrics | Meaningful Metrics |
| ✗ Likes & reactions | ✓ Conversion rate |
| ✗ Follower count | ✓ Cost per acquisition (CPA) |
| ✗ Reach & impressions | ✓ Qualified lead volume |
| ✗ Page views (in isolation) | ✓ Revenue per channel |
| ✗ Email open rate | ✓ Revenue from email |
| ✗ Time on site (alone) | ✓ Customer retention rate |
| ✗ Video views | ✓ Drop-off at key funnel stages |
Vanity metrics make you feel good. They’re shareable, they look impressive in a slide deck, and they’re easy to grow if you put money behind reach. But they often have no relationship with revenue.
Real metrics make you think. They raise questions. If your conversion rate drops, you have to figure out why. If your cost per acquisition spikes, you have to figure out what changed. These metrics require you to actually understand your marketing — and that’s why they’re valuable.
This doesn’t mean vanity metrics are useless. Reach matters if you’re building brand awareness with a specific goal attached. The issue isn’t the metric itself — it’s using it as a proxy for business success when it isn’t one.
ROI vs ROAS — The Confusion That’s Costing Businesses Money
These two get used interchangeably. They shouldn’t be.
ROAS (Return on Ad Spend) tells you how much revenue you generated for every rupee or dollar spent on ads. If you spend ₹10,000 and generate ₹40,000 in revenue, your ROAS is 4x. Platform dashboards love showing you ROAS because a high number feels like a win.
ROI (Return on Investment) tells you whether the whole campaign was actually profitable when you factor in everything — product cost, fulfilment, team time, agency fees, platform fees, and yes, ad spend.
Here’s why this distinction is critical: a campaign can have excellent ROAS and still be a bad business decision.
| REAL-WORLD EXAMPLE A brand runs an ad campaign. ROAS comes back at 5x — looks great. But the product margins are thin, fulfilment costs are high, and when you factor in everything, the actual profit from those sales barely covers what was spent. The campaign looked like a success at the surface level. At the business level, it broke even at best. This happens constantly — especially in e-commerce, where platform ROAS looks strong but blended CAC (Customer Acquisition Cost) tells a completely different story. |
The rule: use ROAS to optimize ad efficiency. Use ROI to evaluate business outcomes. You need both — but you cannot substitute one for the other.
Attribution Models — Which One Should You Trust?
Attribution is the question of: which touchpoint gets credit for the sale?
Someone sees your Instagram ad on Monday. Googles your brand name on Thursday. Clicks a retargeting ad on Saturday. Buys on Sunday after getting an email. So which channel “caused” the purchase?
Last-click attribution gives 100% credit to the final touchpoint before purchase. Simple, easy to track — but badly undervalues everything that built awareness and consideration.
First-click attribution gives 100% credit to the first touchpoint. Better for understanding discovery channels — but ignores everything that actually closed the sale.
Multi-touch attribution spreads credit across all touchpoints. More honest, more complex, and harder to act on — but gives the closest picture of how your marketing actually works together.
The honest answer is: no model is perfect. Every model is a simplification of a messy, human buying journey that doesn’t follow neat rules. What matters isn’t finding the “right” model — it’s using one consistently, understanding its blind spots, and interpreting the data with those limitations in mind.
The bigger insight: attribution tells you where credit is going. It doesn’t always tell you where the actual value is being created.
What Businesses Should Actually Be Measuring
If you’re building a marketing measurement system from scratch, here’s what deserves to be on the dashboard — and why.
Lead quality, not just lead volume. A hundred leads mean nothing if none of them are a fit for your product. Track the ratio of qualified leads to total leads. If that ratio is low, you have a targeting problem or a messaging problem — neither of which volume alone will reveal.
Conversion at each stage. Where are people dropping off? Between ad click and landing page? Between landing page and form fill? Each stage is a separate problem with a separate fix. You can’t find it if you’re only measuring start and end.
Revenue contribution by channel. Which channels are actually driving money — not just traffic. This is the number that justifies budget allocation, and it’s the one most businesses don’t have clearly.
Customer Lifetime Value (even roughly). A customer who spends ₹5,000 once is worth less than a customer who spends ₹2,000 three times a year for four years. If you’re not factoring LTV into your acquisition cost thinking, you’re likely underspending on high-value segments and overspending on low-value ones.
Drop-off points. Where does interest die? This is where improvement lives. Most marketing teams focus on what’s working — the better question is where are we losing people and why.
The Real Skill: Reading the Data, Not Just Collecting It
This is the part they don’t teach in digital marketing courses, because it’s not teachable through a checklist.
Data doesn’t give you answers. It gives you signals. And signals need to be interpreted by someone who understands the business context, the market, the customer, and the moment.
Your bounce rate went up 12% this month. Is that bad? Depends. Did you change the landing page? Did a new traffic source kick in that attracts a different audience? Did a blog post start ranking that brings informational visitors who were never going to convert anyway? The number alone tells you nothing. The number plus context tells you something. The number plus context plus judgment tells you what to do.
This is why senior marketers are not just data readers — they’re data interpreters. The value they bring isn’t access to dashboards. It’s the ability to look at a set of signals and ask the right next question.
“The value is not in the dashboard. It’s in how you read it — and what you do next.”
Common Mistakes That Look Like Good Practice
| 01 | Chasing the lowest CPL without checking quality A ₹50 lead that converts is worth infinitely more than a ₹5 lead that doesn’t. Optimising purely for cost per lead without tracking lead quality downstream is one of the most common and most expensive mistakes in performance marketing. |
| 02 | Trusting only platform-reported metrics Google, Meta, and LinkedIn all report conversions using their own attribution. Each will often take credit for the same sale. Cross-referencing with actual CRM or sales data almost always tells a different story. |
| 03 | Ignoring offline impact Not every customer decision happens online. Word of mouth, in-person experiences, and brand reputation all influence buying — and none of them show up in a Google Analytics report. |
| 04 | Reporting without insight Sending a monthly report that says ‘reach was up 18%, CTR was down 3%’ isn’t analysis. It’s narration. Good reporting doesn’t just describe what happened — it explains why, and what you’re going to do about it. |
| 05 | Measuring everything equally Not all metrics deserve the same weight. When everything is tracked, nothing is prioritised. Your dashboard should reflect what the business cares most about — not every metric your analytics tool can produce. |
What to Stop Measuring (Or Stop Obsessing Over)
This is the uncommon conversation, and probably the most useful one.
Stop making follower count a performance metric. Unless growing an audience is directly tied to a business model (like a creator or media brand), follower growth is a vanity metric that tells you about content appeal, not business health.
Stop reporting impressions as a success story. Unless your specific goal is awareness, and you’ve set a benchmark tied to business outcomes, impressions are background noise.
Stop measuring every channel in isolation. Modern customers move across channels constantly. Silos in your measurement produce silos in your thinking.
Stop treating activity as proof of work. The number of posts, emails, or campaigns launched is not a measure of marketing effectiveness. Output is not outcome.
The “What to Measure” Framework
| 1 | What is the business goal? Not the marketing goal — the actual business goal. More revenue? More retained customers? Lower acquisition cost? Start here. |
| 2 | What action leads to that goal? What specific customer behaviour, if it happened more, would directly move the business goal forward? |
| 3 | What metric reflects that action? Now you have your KPI. It’s not arbitrary — it’s directly connected to the behaviour that moves the goal. |
| 4 | What influences that metric? These are your supporting metrics. They explain why the KPI is moving — and they’re where you find the levers to pull. |
This framework works because it forces you to start with purpose, not with data. Most measurement systems are built the other way around — people look at what they can track and work backwards. That’s why they end up measuring the wrong things.
Every metric should answer a question. If you can’t articulate what question a given number answers, it probably doesn’t belong on your dashboard.
| Data Doesn’t Replace Thinking. It Improves It. The best marketing decisions aren’t made by the teams with the most data. They’re made by the teams who knew which data mattered, asked better questions about it, and had the courage to act on what they found. “Better marketing doesn’t start with more dashboards. It starts with better questions.” |
Worth to read. Thankyou
Glad to hear. You can also check out my other blogs
About Seo Aeo and Geo https://ashiqazain.com/seo-vs-aeo-vs-geo-future-of-search-visibility/
About integrated marketing and different channels https://ashiqazain.com/integrated-marketing-learn-atl-btl-ttl-and-digital/
😊